
Blending incremental costing in activity-based costing systems
Allocating cost fairly across different parts of a business is a common requirement for regulatory purposes or to comply with competition law on price-setting. One popular approach to cost allocation, used in many sectors, is activity-based costing (ABC), a method that identifies the causes of cost and allocates accordingly. However, ABC does not consider the incremental cost of a product,1 which can be a relevant cost benchmark for setting prices. It is possible to create a purpose-built long-run incremental cost (LRIC) model, as has been done in some regulated sectors, but this can be expensive and time-consuming. We explain how an existing ABC system could be used to estimate a LRIC and where that cost estimate would lie on the broad spectrum of incremental costs.
Activity-based costing
ABC systems have formal endorsement from regulators across a number of sectors and jurisdictions for use in calculating fully allocated costs (FACs). For example, in the UK the regulator Ofcom requires Royal Mail to calculate FACs using ABC2 and provides an illustration of Royals Mail’s costing system, shown in Figure 1 below.
Figure 1 ABC costing system

The process shown above is entirely conventional and shows the multistage allocation process from the general ledger. Expense lines are consolidated into cost types that are then allocated to activities using resource drivers. Activity costs are then allocated to products by ‘activity drivers’, using ‘proportional factors’—typically numbers of transactions—sometimes coupled with ‘weighting factors’ to reflect the complexity of a transaction. Regulators often fit ABC into a hierarchy of preference. For example, the UK’s Payment Systems Regulator (PSR) specifies that:3
- expenses that are directly attributable shall be allocated to the relevant activity;
- expenses that are not directly attributable, i.e. are indirect, shall be allocated using ABC;
- expenses that cannot be allocated using ABC shall be allocated according to an alternative method with a supporting explanation.
On the last point, the simplest alternative method is equi-proportional mark-up (EPMU), where indirect costs are allocated in proportion to direct costs—but there are many alternative allocation approaches.4
Incremental costing
Incremental costing is closely related to marginal costing, or the cost of producing an additional unit of output. In economic theory, allocative efficiency is achieved if prices are set at marginal cost as this leads to optimal allocation of resource. However, in practice this can prevent the recovery of fixed costs and this is especially the case in network industries, where the pricing decision has to reflect the fixed cost of building and maintaining capacity. This is where different forms of LRIC can have a role in price-setting, which is why it is of interest to regulators.
Unsurprisingly, the most important question to pose when calculating a LRIC is ‘What is the increment?’ An increment could be a single unit of output, i.e. a marginal cost, and is likely to be very small in a network industry with high fixed costs. More commonly, however, it is a particular product; when the increment is large, such as a product group, it is also possible to calculate the average incremental cost for the product to produce a ‘LRAIC’—i.e. an averaged LRIC. This is likely to be larger than a ‘pure LRIC’ as it will include costs that are shared across the related products, meaning that more costs would be avoided if the large increment is removed. This brings us onto cost–volume relationships (CVRs), which relate avoided costs to reductions in volume.
Cost–volume relationships
CVRs apply at the activity level, as shown in Figure 2 below. The cost of an activity will reflect the activity level and will reduce if the level, measured by activity driver volume, reduces. However, a linear relationship may not always be present. In the presence of fixed costs one would expect a concave relationship showing economies of scale.
Figure 2 Cost–volume relationship of an activity
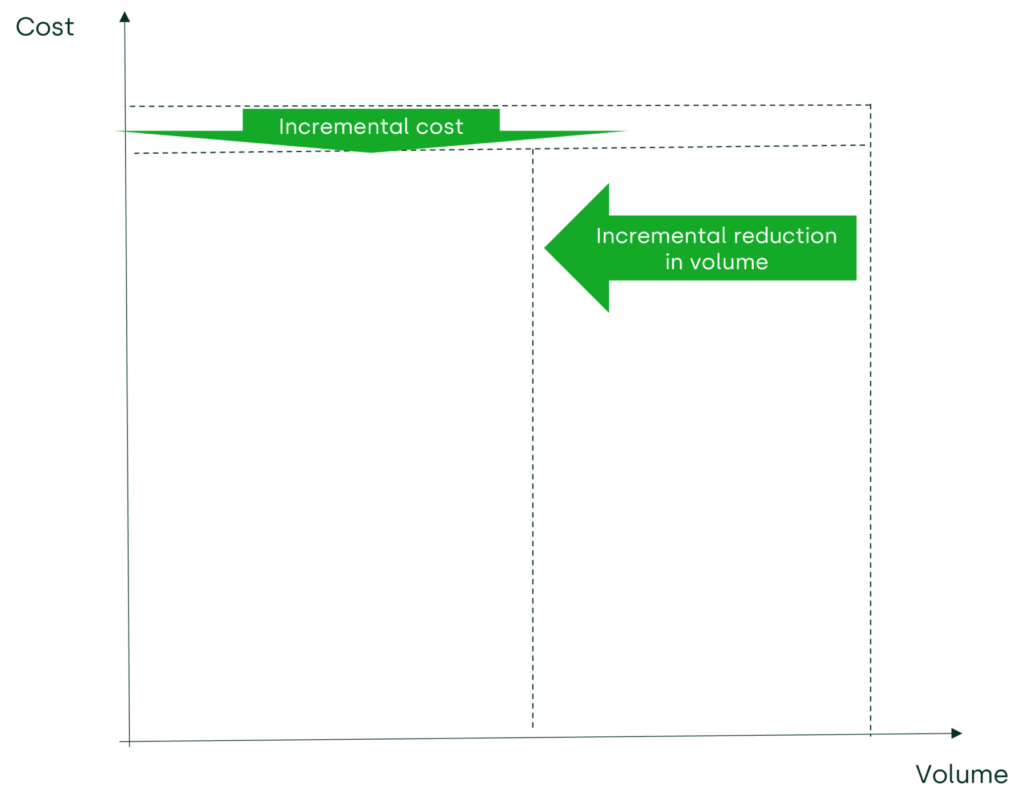
The figure shows that if an increment is removed then cost will fall by a less than proportionate amount. If the CVRs are known for all activities then a LRIC model can be built using a ‘bottom-up’ approach that begins by analysing low-level activities and aggregating their costs upwards. Such models are usually ‘forward-looking’, as the objective is usually to model how cost will vary in the future; forward-looking models include only the activities required for the service and not those that exist for historical reasons. Such bottom-up models are, however, time-consuming and expensive to construct. Given this, some prefer to adapt an existing cost model to approximate LRIC costs.
Adapting an ABC model
If a company has an ABC model for calculating FAC on a historic basis, i.e. using costs recorded in the ledger, it is possible to adjust this model to estimate historic LRIC for a product or service. The first step would be to identify the increment to be analysed and then to pose the counterfactual question for each activity—‘What would the cost be, if that increment was no longer provided?’ A variety of answers are possible:
- no change in costs at all, if the activity was entirely fixed. In this case the LRIC would be zero;
- a proportionate fall in costs if the activity was entirely variable. In this case no adjustment to the ABC allocation principles would be required;
- a less than proportionate fall in costs, e.g. a fall of 15% cost for a 30% reduction in volume, as shown in the figure (not to scale). This would equate to a cost elasticity of 50%.
These different scenarios could by characterised by a ‘LRIC factor’ applied to a product line to adjust the FAC costs where necessary. For the scenarios above, the LRIC factors would be 0%, 100% and 50% and these factors could be used to adjust the activity drivers in the ABC model.
Where the LRIC factor is less than 100%, it would reduce the costs allocated to a product, resulting in LRIC being less than FAC, as expected. Note that if an actual elimination of an increment occurred, this would result in an increase in the FAC of the remaining products. This would reduce their volumes as well, if their demand was elastic, but consideration of this effect is outside the scope of estimating LRIC for pricing purposes. In the box below, a simple worked case is provided showing the calculation of a LRIC for an increment.
Worked case
Assume that there are three activities: fixed (F), variable (V) and hybrid (H), with cost elasticities of 0%, 100% and 50% respectively. Assume that the historic annual costs for F, V and H are €72, €120 and €288 respectively, making a FAC of €480 in total.
If the activities are consumed in similar amounts by three products (A, B and C) with annual production of four units each, that is 12 units in total, giving a FAC of €40 per unit (a 12th of €480).
If four units of product C were removed, the costs for F, V and H would be €72, €80 and €240, equalling €392 in total. This is a €88 reduction from the original €480, giving a unit LRIC for C of €22 for each of its four units. If the hypothetical removal of C had actually occurred, the unit FAC for the remaining eight units of A and B would have risen to €49 (an eighth of €392).
This hypothetical exercise could be repeated for the removal of both B and C. The resulting annual cost would be €304, or a hypothetical unit FAC for the remaining four units of A of €76 (a quarter of €304). In practice, such a result would be implausible as production of A would cease, or there would be a restructuring to reduce fixed or semi-fixed costs.
Source: Oxera.
The simple case in the box is only illustrative and, where there are hundreds of activities and products, as is typical, the ABC system would need to be adjusted with LRIC factors reflecting the cost elasticities of the relevant activities (in the worked example the factors would be 0%, 100% and 50% for the three activities F, V and H). Obtaining this data involves posing the counterfactual question ‘What would the cost be if the increment were removed?’ to operations and accounting staff and then seeking as much supporting evidence as possible, ideally in a format discussed with any regulator beforehand.5 The answers to these questions are then used to create the LRIC factors to be applied to the ABC system.
Spectrum of LRIC
It should be noted that the process outlined above does not attempt to replicate the non-linear CVR shown above. In an ABC system the implicit CVR is a straight line passing through the origin; making an adjustment for the LRIC factor simply changes the slope. There are a variety of LRICs, from a small ‘pure LRIC’ to a larger LRAIC6 for broad increments, and there is an even broader measure, LRAIC+, where the ‘+’ sign indicates a mark-up to provide for a contribution to corporate common costs, which then becomes similar to FAC. This is illustrated in Figure 3 below.
Figure 3 Spectrum of LRICs
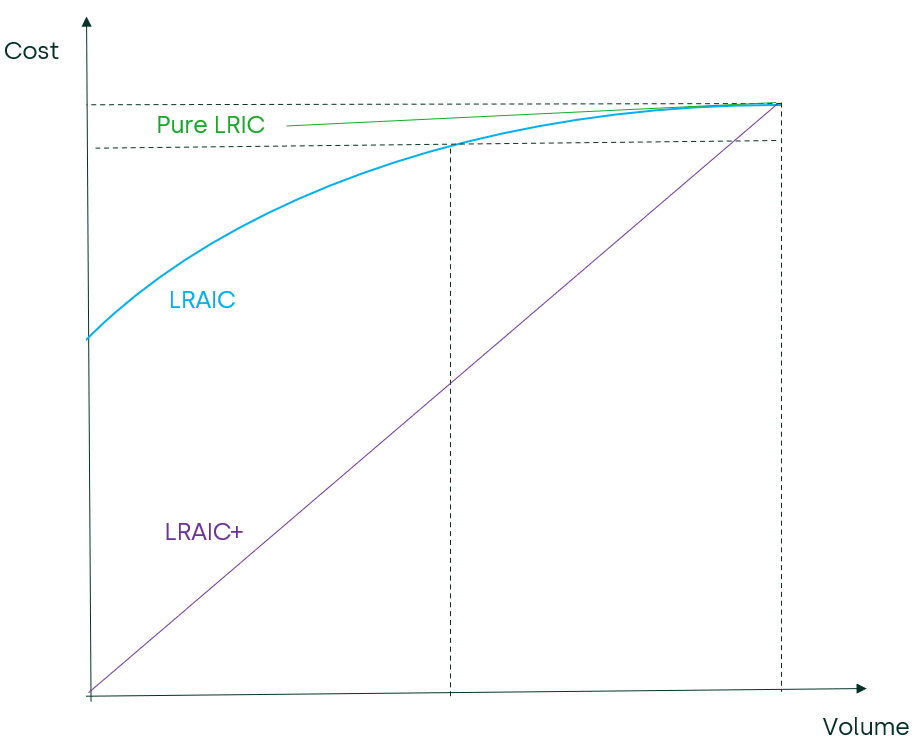
The estimates for LRIC produced by adjustments to the ABC system would be closer to the LRAIC and LRAIC+ end of the spectrum, as the answer to the counterfactual question on cost reduction in practice would take into account the reduction in activity-level fixed or semi-fixed costs. As for the corporate-level fixed costs, a view would need to be taken on whether to include these in the analysis, with low elasticity (bearing in mind that no costs are not truly fixed in the long run),7 or to exclude them entirely.
The tendency to produce LRIC estimates on the high side can be classed as ‘conservative’ when dealing with competition law challenges (e.g. claiming predatory pricing by undercutting competition with prices that are unfairly low). Setting prices in line with a ‘conservative’ LRIC will help to rebut any such challenge.
Adjustments to historic cost
The LRIC estimates produced by the ABC systems are historic top-down estimates, but it could be argued that some historic costs are no longer relevant. These might include:
- historic depreciation, perhaps replaced by economic deprecation;
- the running costs of redundant assets;
- inefficiencies and fines.
Any such adjustments should be consistent with relevant regulatory policies.
Conclusion
For network industries, LRIC estimates could have a crucial role in a price-setting context, supporting regulatory or competition law challenges. In some cases, a purpose-built LRIC model will already exist, but where this is not the case and there is an existing ABC model used to calculate FAC, fairly simple modifications to that model could be used to produce reasonably conservative LRIC estimates.
1 In this article ‘product’ is taken to include ‘service’.
2 See, for example, Ofcom (2019), ‘Review of regulatory financial reporting for Royal Mail Cost allocation and transfer pricing’.
3 Payment Systems Regulator (2018), ‘Onshoring EU Regulatory Technical Standards under the Interchange Fee Regulation’.
4 These alternatives will be the subject of a second article, as the prime interest in this article is to consider how to add incrementality into ABC systems rather than to choose between alternative FAC principles.
5 Given the difficulty of verification, some regulators have been reluctant to adopt LRIC estimates from operators. An example is the case of Royal Mail, whose LRIC estimates were not accepted by Ofcom: see Ofcom (2018), ‘Amendments to the Universal Service Provider Access Condition in relation to the margin squeeze control’, Statement, 8 November. Ofcom instead used 50% of FAC as a ‘reasonable conservative estimate’ of incremental costs: see Ofcom (2011), ‘Securing the Universal Postal Service. Proposals for the future framework for economic regulation’, October, p. 7.85.
6 The ‘A’ in LRAIC refers to ‘average’, and is relevant to a large increment of related products, whose elimination would include some of the production-fixed costs used to support the product group.
7 Even the usually cited case of the chairman’s salary has a variable component; if a company reduces in size, one could expect a lower pay for board members.

Related

The European growth problem and what to do about it
European growth is insufficient to improve lives in the ways that citizens would like. We use the UK as a case study to assess the scale of the growth problem, underlying causes, official responses and what else might be done to improve the situation. We suggest that capital market… Read More

The 2023 annual law on the market and competition: new developments for motorway concessions in Italy
With the 2023 annual law on the market and competition (Legge annuale per il mercato e la concorrenza 2023), the Italian government introduced several innovations across various sectors, including motorway concessions. Specifically, as regards the latter, the provisions reflect the objectives of greater transparency and competition when awarding motorway concessions,… Read More