Odds on? What was the probability of Leicester City’s 2016 success?
English Premier League fans witnessed a season full of surprises in 2015/16. The ‘usual suspects’ for winning the league, and thereby progressing to the financially lucrative UEFA Champions League, performed unexpectedly poorly (with the exception of Arsenal). Arguably the biggest surprise, however, was the remarkable performance of Leicester City. In its second English Premier League season after its promotion from the Championship, Leicester City won the title.
What were the odds of Leicester City leapfrogging to the top of the league? And will the club be able to maintain its success in the years to come? The answers to these questions depend on an interplay of factors, including whether Leicester continues its run of good luck; the investment required to give it a decent chance of success in the future; and the impact of UEFA’s FFP regulations.
What were the real odds of Leicester City’s success?
According to UK bookmakers, Leicester City entered the English Premier League with odds of 5,000 to 1 of winning the title. To put this into perspective, 5,000 to 1 were the same odds offered against Elvis being found alive, the Loch Ness Monster being proven to exist, or TV personality Kim Kardashian becoming President of the USA in 2020.[1]
Assuming that betting markets work well, these odds should have indicated what the market considered the chances of Leicester City winning the English Premier League to be. Oxera put these odds to the test by developing a statistical model—based on analysis of historical football and financial data since 2002—to predict each club’s likelihood of success. This was based on (i) wage spend, which is arguably the most important determinant of rank and a reasonable proxy for player quality; and (ii) where the club finished in the previous season. The analysis identified these two parameters as highly statistically relevant.[2]
The results from the Oxera model indicate that, at the start of the 2015/16 season, given its wage spend relative to the league average and the team’s finishing position in the previous season (14th), Leicester City was expected to win the English Premier League title with a probability of 0.004%. That is, the ‘fair’ odds that would reflect the true likelihood of Leicester City’s success were around 20,000 to 1. It therefore seems that the odds offered by the bookmakers were not as generous as they might have appeared.
Of course, other features will influence the outcomes of sports events, and these might be considered to augment such a model. For example, less readily quantifiable measures such as the quality of the team’s players, the manager’s experience, the backroom and coaching staff’s effectiveness, or ‘innovative’ techniques and the recruitment of players based on statistics[3] could all be taken into account. Arguably, the bookmaker’s assessment took greater account of these ‘soft’ factors.
However, it would appear that the bookmakers did well regardless of the apparent generosity of their 5,000 to 1 offer. At the time, even the majority of die-hard Leicester supporters were sufficiently unconvinced and kept their money in their pockets, with the bookmakers taking very few significant bets on Leicester City winning the English Premier League. As bookmaker, Ladbrokes, reported, ‘we did well out of Leicester upsetting the odds’.[4]
Either way, the odds offered by bookmakers or calculated by Oxera suggest that Leicester City, or any other lower-/mid-table English Premier League club that spent as much on wages as a typical club in that position (around £60m),[5] would need to be exceptionally fortunate to replicate Leicester City’s success in the 2015/16 season. More detailed results, together with a description of Oxera’s statistical model, are given in the box below.
What are the odds? Digging deeper into the numbers
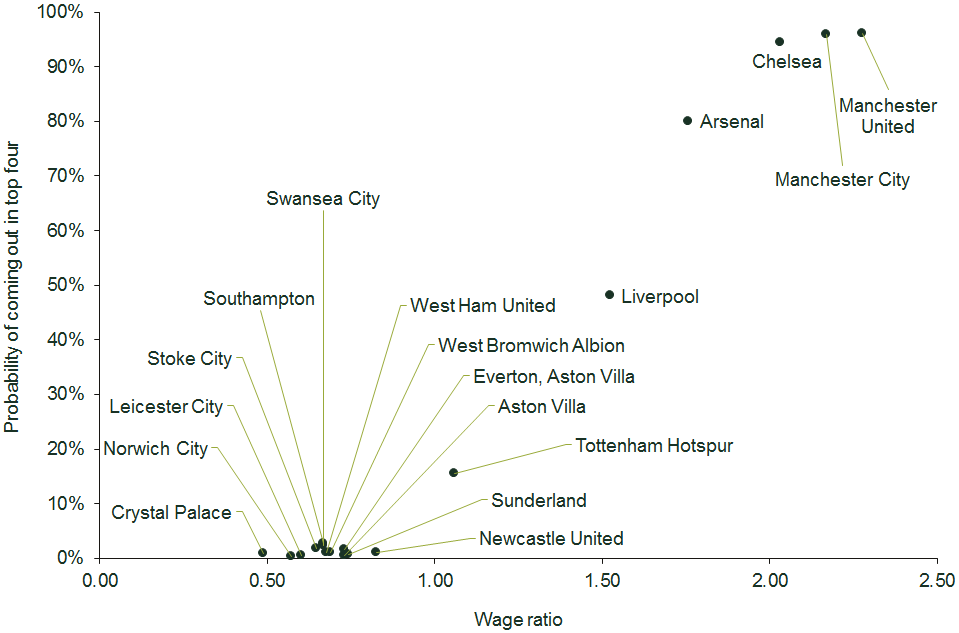
The figure below shows each club’s wage ratio, and its probability of finishing in the top four in the English Premier League.

Source: Oxera analysis.
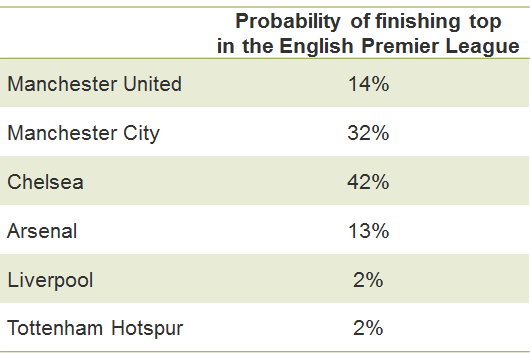
To predict the likelihood of a club being in a given rank according to its wage spend and league position in the previous season, Oxera built a statistical model.1 In this model, the outcome variable indicates whether a club will finish either top or within the top four2 of the English Premier League (depending on which outcome is analysed). The table below indicates the model’s predictions of the top six teams (in terms of wages) finishing first—which are broadly in line with the odds that bookmakers offered at the start of the 2015/16 season.

One of the explanatory factors used in Oxera’s model is the wage spend of a club relative to the league average. For instance, Manchester United’s wage ratio is around 2.3, which indicates that the club spent more than twice as much on wages as the average English Premier League club in a given season. It is reasonable to expect that clubs with a higher ratio will be better performers. Indeed, the relationship between wage spend and football success has been widely examined in the academic literature. Szymanski (2014) argues that ‘there are many reasons to believe that this relationship is causal: players are widely and openly traded in the market, player characteristics are well known and frequently observed, better players tend to win more games, and teams that win generate more income’.3 Of course, increasing wage spend alone does not guarantee success—it needs to be accompanied by an improvement in the quality of players.
Another explanatory factor included in the regression is the ‘lagged rank’, which indicates the club’s league position in the previous season. The model for predicting a team’s probability of finishing in the top four is specified as:
Probability (top 4) = function(relative wage spend, lagged rank)
Leicester City incurred a wage bill of around £60m in 2014/15, while the average of the remainder of the league was just over £90m (estimated). This gives Leicester a ratio of slightly below 2/3, which, combined with its previous league position of 14th in the 2014/15 season, led to Oxera’s model predicting a very low probability.
Note: 1 Oxera used a logit model, which is a regression model where the outcome variable is categorical—i.e. equal to only a limited and fixed number of possible values. For example, if the outcome variable were continuous (e.g. the numbers of points a team collected) then a logit model would not be appropriate. 2 The top three teams qualify directly for the Champions League, and the team in fourth place enters a play-off stage. 3 For example, see Szymanski, S. (2014), ‘Stefan Szymanski on the business of football’, The Open University, 11 April.
Source: Oxera.
Will Leicester City be able to sustain its recent success?
Given Leicester City’s unexpected triumph in 2015/16, one might ask whether the club can capitalise on this momentum to compete with the likes of Manchester United, Liverpool, Chelsea, Arsenal and Manchester City in the longer term.
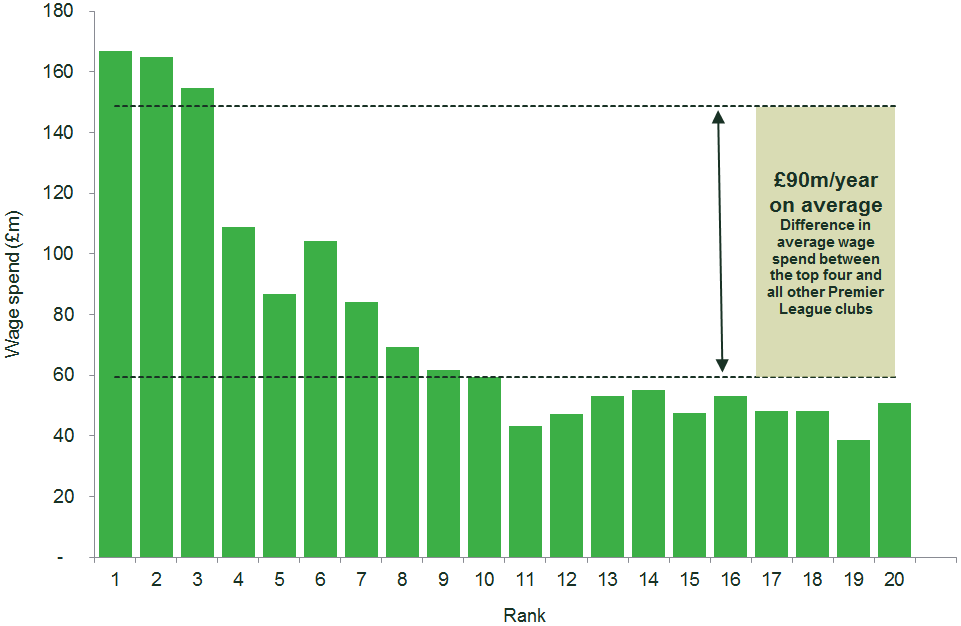
An examination of wage spend among the usual Champions League contenders gives a good indication of the additional spend necessary for Leicester City to be on a par with the ‘elite’ clubs. This is shown in Figure 1 below, which plots the average wage spend of English Premier League clubs over five seasons, sorted by rank.
Figure 1 Average wage spend by English Premier League rank

Source: Oxera analysis based on data from Deloitte.
For example, over the five years to 2012/13, the figure shows that the top four English Premier League clubs spent an average of around £150m per year. After the top four, the remainder of the clubs spent an average of around £60m per year.[6] The differential between the top four clubs and the rest of the league (£90m) gives an indication of the amount required for a smaller club to equalise its wage spend with those of the top four clubs.[7]
An ambitious club might decide to invest in its squad in order to bridge the gap in achieving domestic success and the associated rewards, including qualifying for the Champions League. Would this be a good investment, and what are the odds of it paying off?
To answer these questions, we need to consider the possible revenue streams resulting from further investment in the squad, and the probabilities of achieving the required revenues.
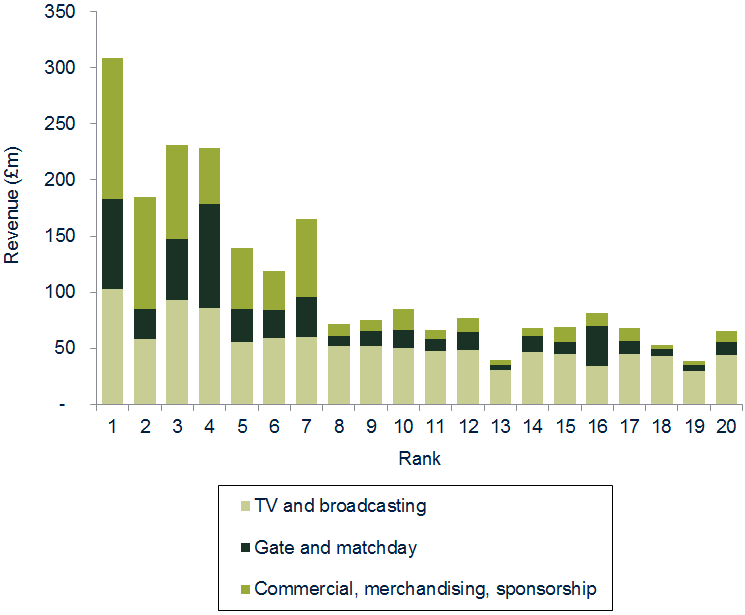
There are, fundamentally, three sources of revenues for football clubs: TV and broadcasting monies; gate and matchday revenues; and commercial or sponsorship income. These revenues are shown in Figure 2, which plots the average revenues generated by English Premier League clubs over four years, sorted by rank.
Figure 2 Revenues by segment and English Premier League rank

Source: Oxera analysis based on data from The Guardian.
On average, the top four clubs brought in around £240m of revenue per year or, on average, £160m more than each of the other teams. Different types of revenue stream, however, are realised at different points in time. While TV and broadcasting revenues adjust immediately (that is, qualifying for the Champions League entitles a team to a share of the large broadcasting prize revenue pot in the following season and a higher share of national broadcasting prize revenue in the current season), gate and matchday income and commercial/sponsorship revenues may take much longer to fully develop.
Growing commercial/sponsorship and gate and matchday revenues largely depends on a club’s ability to expand its fan base and to increase supporters’ willingness to pay. This, in turn, requires the club to establish its reputation through consistent wins and reinvestment of revenues into wages. A further constraint for gate and matchday revenues is stadium capacity. To generate gate revenues comparable to those of the top teams in the English Premier League, a small team would probably need to make large investments in its stadium to reach a comparable capacity. The timescales are understandably long.
One source of the difference in revenue streams between clubs is shirt sponsorship. In the 2015/16 season, Manchester United’s shirt sponsorship deal with Chevrolet was worth £53m per season. This is ten times the combined shirt sponsorship revenue that Southampton (£1m), Leicester City (£1m), Watford (£1m), Bournemouth (£1.3m) and Norwich City (£1m) received in the same season.[8]
A team that newly qualifies for the Champions League will secure lucrative TV and broadcasting revenues in the following season, which might be around £30m.[9] It might also gain additional revenues of around £10m in English Premier League prize money in the current season, totalling around £40m in incremental TV and broadcasting revenues.
When the annual £90m ‘price of success’ is taken into account, these potential sources of revenue would still leave a significant deficit of around £50m.[10] This suggests that a club’s attempt to break into the ranks of the Champions League through increased spending is a risky gamble that (even if successful[11]) would take a long time to pay off. This long payback period is due to the combination of the significant increase in wage spend required and the fact that it takes time to grow the other revenue streams (matchday/gate and commercial/sponsorship revenues) to close the annual deficit.
Post-match briefing
The calculations set out in this article indicate that, even ignoring FFP rules, a new entrant’s foray into the Champions League through increased spending is a high-stakes game. Nevertheless, clubs with an appetite for risk could still take the gamble, depending on how far they are willing to stretch the budget constraint. This is arguably what Manchester City did after the club changed owners in 2008. Between 2007 and 2013, wage spend at Manchester City increased more than fourfold, leading (together with transfer fees) to a cumulative loss of more than £500m over the same period.
The introduction of FFP rules alters the risk–reward balance of investing in securing a spot in the Champions League. In 2008, when Manchester City took the gamble, the main constraints of the investment decision were the owner’s risk appetite and the budget.
UEFA FFP rules, in particular the ‘break-even’ rule, effectively impose further constraints to the investment decision. Under the break-even rule, UEFA’s Club Financial Control Body (CFCB) will assess a club’s finances over a period of three seasons. If a club incurs a deficit of greater than €5m within the three-year assessment period, the CFCB can impose penalties such as a warning, a points deduction, or fines. If the owner injects equity into the club to cover such losses, the maximum permitted loss increases to €30m.
The break-even rule therefore makes the increase in wage spend described above virtually impossible, and rules out of the level of investment that Manchester City’s owners made when they bought the club in 2008.
The odds of Leicester City sustaining its 2015/16 season’s performance in the long term are therefore likely to be even lower than the odds for its current performance.
The next sports finance article will focus on the UEFA FFP rules and the extent to which they restrict the ability of teams to invest, and thereby potentially act as a barrier to entry for medium and smaller teams to become one of the ‘elite’ clubs. It will also examine the impact of the new TV and broadcasting deal that is due to begin in the 2016/17 season, which will change the landscape of English Premier League teams’ income.
[1] Some other 5,000 to 1 bets offered by bookmaker, William Hill, include: Christmas being the warmest day of the year in England; Kanye West and Kim Kardashian naming their next child Sinner; and Barack Obama playing cricket for England after his presidential term finishes. Source: Markazi, A. (2016), ‘The Longest Shots’, ESPN, 2 December.
[2] Player transfer fees could also be included as a determinant although, given their high correlation with wage spend, these are unlikely to explain much more of the variation in a team’s performance.
[3] Micklethwait, J. (2016), ‘Leicester City: Dirty Dozen or Harvard Case Study?’, 26 April, Bloomberg View.
[4] Alex Donohue from the bookmaker, Ladbrokes, reported in Young, E. (2016), ‘Leicester City: “Every bookmaker is crying out in pain”’, BBC News, 4 May.
[5] Leicester City Football Club (2016), ‘Leicester City FC Financial Results 2014/15’, 3 March.
[6] Leicester’s wage spend is similar to those of most clubs outside the top four that also had a very low probability of winning the English Premier League.
[7] The difference between Leicester City’s wage, £57m, and those of the top four is around £90m.
[8] totalSPORTEK (2016), ‘All 20 Premier League Clubs Shirt Sponsorship Deals 2015-16’, 2 March.
[9] Assuming that the team does not make it to at least the quarter-finals.
[10] This is the difference between the short-run incremental costs of around £90m for additional wage spend, and the short-run incremental TV and broadcasting revenues of around £40m for a team that newly qualifies for the Champions League.
[11] This is a big ‘if’. If a team such as Leicester City increased its annual wage spend (by improving the quality of its players) to bring it on a par with the usual title contenders, the probability of achieving a Champions League position in the subsequent season would still be only around 55%.
Download
Related

The 2023 annual law on the market and competition: new developments for motorway concessions in Italy
With the 2023 annual law on the market and competition (Legge annuale per il mercato e la concorrenza 2023), the Italian government introduced several innovations across various sectors, including motorway concessions. Specifically, as regards the latter, the provisions reflect the objectives of greater transparency and competition when awarding motorway concessions,… Read More

Switching tracks: the regulatory implications of Great British Railways—part 2
In this two-part series, we delve into the regulatory implications of rail reform. This reform will bring significant changes to the industry’s structure, including the nationalisation of private passenger train operations and the creation of Great British Railways (GBR)—a vertically integrated body that will manage both track and operations for… Read More

