RIIO-ED2 Final Determinations
On 30 November 2022, Ofgem published its Final Determinations (FDs) for the RIIO-ED2 price control covering the electricity distribution (ED) sector for the next five years from April 2023 to March 2028.1 The FDs followed the RIIO-ED2 Draft Determinations (DDs) published five months earlier on 29 June 2022.2 Overall, Ofgem has increased TOTEX allowances where it has assessed that distribution network operators (DNOs) provided stronger evidence, while the allowed rate of return was increased reflecting changes in interest rates in the UK.
The key facts from the FDs were:
- an 11.8% cut to baseline TOTEX allowances relative to the DNOs’ requests—this compares to a 17% cut in the RIIO-ED2 DDs, and an 11% cut for gas distribution (GD) and a 21% cut for transmission (T) networks at the RIIO-GD2/T2 FDs stage relative to the networks’ requests;
- an ongoing efficiency (OE)target of 1.0% p.a., which is broadly aligned with the outcomes of recent CMA energy and water appeals and redeterminations, while being less challenging than the target in the RIIO-ED2 DDs;3
- a more reasonable approach to deriving the catch-up efficiency challenge by triangulating modelled costs from the top-down and the bottom-up assessment, prior to determining the benchmark— unlike at the DDs stage, this thereby avoids setting an infeasible benchmark that no DNO has achieved;
- a benchmark set at the 85th percentile for the efficiency challenge (with a glide path from the 75th percentile), which is the same as in RIIO-GD2, and is unchanged compared to the DDs;
- incentive rates (the share of under- or out- performance that companies will keep) of between 49.3% and 50%, which is similar to the RIIO-ED2 DDs (49.2–50.0%) and RIIO-GD2 (49–50%), but is higher than in RIIO-T2 (33–49%);
- a total range of Output Delivery Incentive (ODI) rewards and penalties of between +2.65% and -4.0%, in terms of the return on regulated equity (RoRE)—this has increased at the rewards end of the range from +1.95% and -4.0% in the RIIO-ED2 DDs;
- an increase in the Business Plan Incentive rewards and no penalties, compared to lower rewards and a penalty for one DNO at the DDs stage;
- an allowed return on capital of 3.90% (CPIH-real), compared to 3.26% (CPIH-real) in the RIIO-ED2 DDs and 2.81% (CPIH-real) in RIIO-GD2/T2,4 with a 55bp premium added to the cost of debt allowance methodology, and the rest of the change in the allowed return on capital being due to the mechanistic updates of the allowed risk-free rate and the cost of debt to reflect the latest market data;
- unchanged from the DDs Return Adjustment Mechanism (RAM) thresholds at three and four percentage points deviation from the baseline return, corresponding to companies keeping 50% and 10% of the returns beyond those thresholds;
- all companies meeting Baa1 or A3 notional credit rating in the baseline case (same as in the DDs), with adjusted interest coverage ratios (AICRs) ranging from 1.31x–1.42x (1.30x–1.43x in the DDs).
Ofgem explains that supporting the delivery of net zero at the lowest-cost continues to be its key consideration when making decisions in relation to energy networks’ price controls. In addition to that, Ofgem had to account for a rapid increase in interest rates in the UK—particularly pronounced in the last months before the FDs. We discuss Ofgem’s approaches to both net zero and increased interest rates below, before providing more detail on the FDs TOTEX allowances.
Achieving net zero
RIIO-ED2’s objective of delivering net zero at the lowest cost for consumers is based on several distinct pillars:
- higher than in RIIO-ED1 ex ante allowances for load-related expenditure (LRE) to support the adoption of low-carbon technologies (LCTs);
- an agile package of uncertainty mechanisms (UMs);
- a review of the connection costs funding model;
- research and innovation funding.
RIIO-ED2 annual ex ante load-related expenditure (LRE) allowances are 39% higher relative to RIIO-ED1.5 This is despite a £206m reduction in LRE ex ante allowances at the FDs stage compared to the DDs, when it was 50% higher than in RIIO-ED1. The change reflects consultation feedback, and more importantly, Ofgem’s changed assessment of the economic climate, which, according to Ofgem, may lead to a slower uptake of LCTs than previously expected, reducing the urgency with which DNOs need to reinforce the network over the upcoming five-year period. The lower ex ante LRE allowance, coupled with the relevant LRE UMs which will allow networks to recover their costs in case of rapid LCT take-up, aims to balance cost efficiency with network responsiveness in achieving net zero objectives.
In total, Ofgem has put in place 37 UMs, as opposed to the 34 that it proposed in the DDs.6 Of these, 21 are automatic—i.e. pass-through, indexation, use-it-or-lose-it (UIOLI) or volume-driver UMs, whereas 16 are administrative re-openers.
An important newly introduced UM is a scaler volume driver for indirect costs associated with LRE. This mechanism will allow for indirect operational costs to be scaled up in line with the allocation of UM allowances for LRE. These additional LRE-related UMs, which determine the value of the indirect scaler, were proposed in the DDs and include the LRE re-opener, the LRE secondary reinforcement volume driver (which will fund transformer and circuit reinforcements), and the LRE low-voltage services volume driver.7
Moreover, following the Access and Forward-Looking Charges Significant Code Review decision (Access SCR),8 connection customers are expected to pay less towards the reinforcement of existing network assets, where such reinforcement is triggered by their connection request, with the work being, instead, funded through RIIO-ED2 allowances. As a consequence, Ofgem has also provided £439m of allowances to account for the additional connection and reinforcement costs faced by DNOs, although corresponding only to the first two years of the price control.9 No separate ad-hoc UM has been introduced for the SCR as Ofgem considered the nature of the risk to be the same as those covered by other UMs.
Lastly, consistent with the DDs, the Strategic Innovation Fund (SIF) and the Network Innovation Allowance (NIA), have been maintained from the DDs, the latter seeing an increase in funding from £62.4m to £68.4m.
Addressing increased interest rates in the rate of return allowance
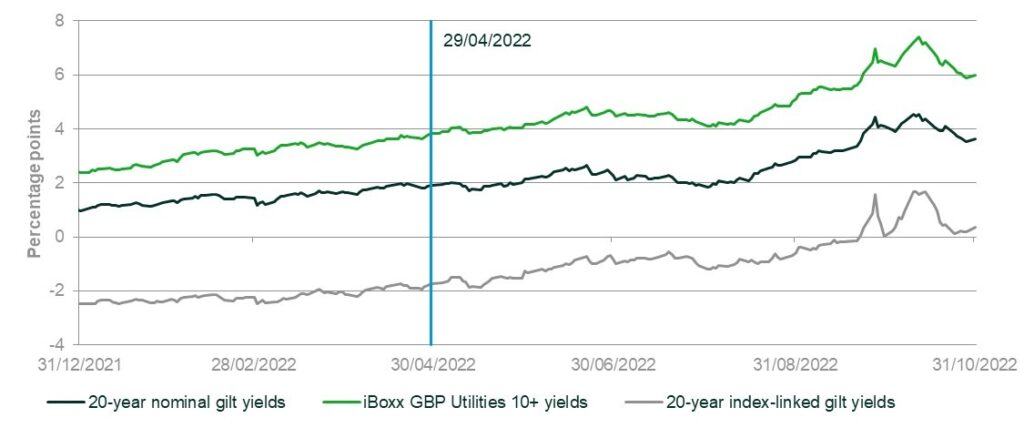
The publication of the FDs followed a period of significant increase in interest rates in the UK, including government bond (gilt) and corporate bond yields, compared to the level of interest rates that prevailed at the time of the Draft Determinations (DDs)—see Figure 1. As a result, Ofgem has increased the allowed return on capital from 3.26% in the DDs, to 3.90% in the FDs, i.e. by 64bps.10
Figure 1 Gilt yields and iBoxx GBP Utilities 10+ index yields (%)
Source: Oxera analysis based on data from Thomson Reuters Datastream and Bank of England.
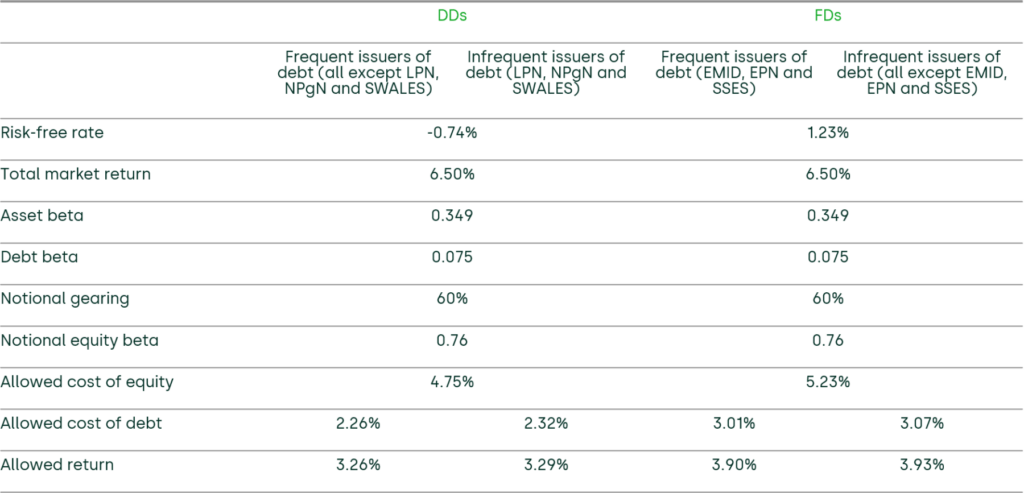
Ofgem has reflected the increase in gilt yields in its cost of equity allowance but kept the methodology behind all of its capital asset pricing model (CAPM) parameters unchanged relative to the DDs.11 As a result, Ofgem has updated the cost of equity allowance from 4.75% to 5.23%, which during the price control, will be indexed to the 20-year index-linked gilt yields—the basis for the risk-free rate allowance.
As regards the cost of debt allowance, Ofgem has added 55bp on top of the 17-year trailing average of iBoxx Utilities GBP 10+ index, and the 25bp additional costs of borrowing allowance provided at the DDs stage. The additional 55bp resulted from Ofgem’s calibration approach under which the allowance has to be expected to cover the average cost of debt for all DNOs. The mechanistic update of the DD allowance for the new iBoxx yields data was no longer sufficient to cover the sector-average cost of debt across a range of scenarios that Ofgem considered to be reasonable, and an additional upwards adjustment of 55bp was incorporated, as part of Ofgem’s assessment at FDs stage.
In addition, Ofgem has allowed 6bp infrequent issuer premium to the networks issuing less than £250m per annum—the threshold was increased from £150m since the DDs and all but three networks have now qualified for it.12
Finally, in line with the DDs, Ofgem has confirmed that the nominal iBoxx yields will be converted into a CPIH-real allowance using the Office for Budget Responsibility’s five-year CPI forecast.
The parameters of the allowed return are summarised in Table 1.
Table 1 Allowed return on capital (CPIH-real)
Source: Ofgem (2022), ‘RIIO-ED2 Final Determinations Finance Annex’, 30 November, https://www.ofgem.gov.uk/publications/riio-ed2-final-determinations (accessed 5 December 2022). Ofgem (2022), ‘RIIO-ED2 Draft Determinations’, 29 June, https://www.ofgem.gov.uk/publications/riio-ed2-draft-determinations (accessed 5 December 2022).
Determination of allowed TOTEX
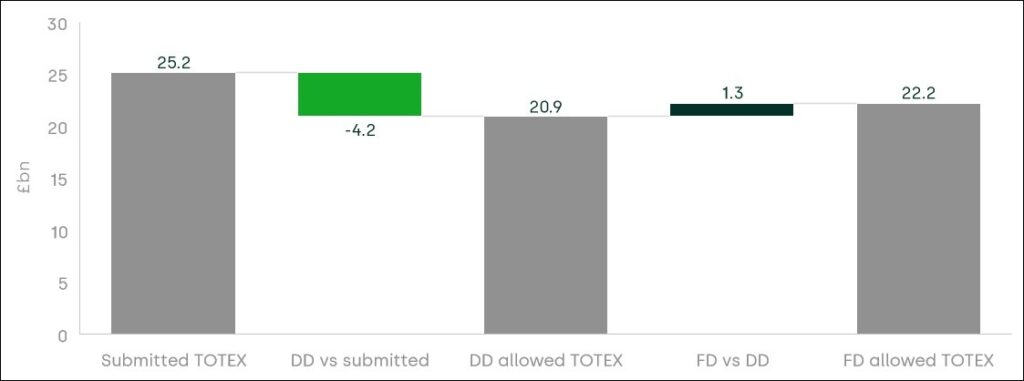
Companies’ submitted cost requirements for RIIO-ED2, as reassessed at the FDs stage, amount to £25.2bn.13 Figure 2 below shows how the final submitted costs compared to Ofgem’s ex ante cost allowances in the DDs and FDs.14 The allowed expenditure in the DDs amounted to £20.9bn, representing a reduction of £4.2bn or 17% compared to the final figure for submitted costs. This downward adjustment is reduced to £3.0bn or 11.8% in the FDs, as the ex ante cost allowance of £22.2bn is £1.3bn higher than in the DDs.
Figure 2 Comparison of ex ante cost allowances across RIIO-ED2
Source: Ofgem (2022), ‘Final Determinations Core Methodology Document’, 30 November, Table 12.
The change in ex ante cost allowances compared to the DDs is driven by:
- updates to the TOTEX and activity level benchmarking;
- changes to the calculation of the demand driven adjustment;
- a reduction of the OE target from 1.2% p.a. to 1% p.a.
Compared to the DDs, these changes result in an upward adjustment of cost allowances for all but one network.15 The implications of the changes are discussed in more detail below.
TOTEX and disaggregated cost modelling
As at DDs, Ofgem used three TOTEX models to derive a top-down view of companies’ expenditure requirements, and a series of disaggregated cost models to assess companies’ expenditure requirements in individual cost categories (i.e. a bottom-up view). Within the top-down assessment, each TOTEX model receives the same weight, i.e. one third. Ofgem then attaches equal weight to the top-down and bottom-up approaches when assessing companies’ overall expenditure requirements (i.e. 16.67% for each TOTEX model and 50% for the disaggregated modelling).
The TOTEX models have broadly remained the same compared to the DDs, with two of them considering ‘activity drivers’. Model 2 accounts for capacity released while model 3 captures the impact of electric vehicles and heat pumps. The main change from the DDs is the inclusion of network length as a cost driver within two of the TOTEX models, which results in a better model fit.16
Volume adjustments
In order to standardise DNOs’ load growth forecasts that are based on different scenario assumptions and to avoid risks of rewarding those submitting over-optimistic LCT forecasts, Ofgem makes a ‘demand-driven adjustment’ to companies’ volumes forecasts of LCT uptake based on an independent System Transformation scenario developed by NG Electricity System Operator (NGESO). While this ‘demand-driven adjustment’ was already used at the DDs, changes made to its computation and its application have resulted in the corresponding 2% reduction of ED2 TOTEX in the FDs, against a 3% reduction in the DDs.
However, it is important to note that LCT uptake is covered by UMs in such a way that higher-than-expected growth will be reflected in DNOs’ allowances.
Efficiency challenges
For its catch-up efficiency challenge, Ofgem decided to retain the DD approach of setting the benchmark at the 85th percentile, with a three-year glide path from the 75th to the 85th percentile. This is consistent with the RIIO-GD2 price control where such a glide path was first introduced.
However, following the concerns that DNOs raised on the level of the catch-up efficiency challenge, Ofgem has amended the way that this is derived. While it was initially computed only on the three TOTEX models, it now integrates modelled costs resulting from the bottom-up assessment. This is based on a weighted average which places 16.67% weight on each TOTEX model and 50% weight on the disaggregated modelling.
In addition to this benchmark, Ofgem is proposing to set an OE target of 1% p.a. from 2021/22,17 this is 0.2 percentage points lower than the DDs’ target of 1.2%.
While Ofgem reiterated that setting an OE target is an exercise of regulatory judgement, it has revised its initial position following consideration of stakeholders’ responses and a re-evaluation of the evidence provided by its consultant.18 The final OE target retained by Ofgem corresponds to the most ambitious challenge proposed by UKPN and ENWL, which are the industry-leading companies according to Ofgem’s assessment. The target is now broadly in line with recent precedent: the CMA RIIO-GD2/T2 energy appeals (0.95% p.a. for CAPEX/REPEX and 1.05% p.a. for OPEX) and the CMA PR19 water redetermination (1% p.a.), but is higher than that proposed by most DNOs in their business plans.
Next steps
The DNOs are now assessing whether the FD package is sufficient for them to finance their operations and growth in the current economic circumstances. Licence conditions will be published in December 2022 and consulted on. Following publication of the decision on licence conditions, companies and third parties will need to decide whether to file an appeal with the CMA on any aspects of the FDs.19
1 Ofgem (2022), ‘RIIO-ED2 Final Determinations’, 30 November, https://www.ofgem.gov.uk/publications/riio-ed2-final-determinations (accessed 5 December 2022).
2 See Oxera’s overview of the Draft Determinations at Oxera (2022), ‘RIIO-ED2 Draft Determinations’, 1 July, https://www.oxera.com/insights/agenda/articles/riio-ed2-draft-determinations/ (accessed 5 December 2022).
3 This compares to 1.2% p.a. at the RIIO-ED2 DDs stage. In RIIO-GD2/T2, Ofgem set the OE challenge at 1.15% and 1.25% p.a. for CAPEX/REPEX and OPEX respectively, but the CMA has retained a less challenging target of 0.95% and 1.05% p.a. With respect to the water sector, the CMA’s PR19 redeterminations led to an OE challenge of 1.0% p.a., 0.1% lower than Ofwat’s FDs.
4 Specified for the companies not qualified for the infrequent issuer premium.
5 Ofgem’s estimate. See Ofgem (2022), ‘RIIO-ED2 Final Determinations Core Methodology Document’, 30 November, para. 3.8.
6 The three additional UMs correspond to: (i) the replacement of the miscellaneous pass-through UM with the two pass-through mechanisms: for bad debt and for supplier of last resort; (ii) a scaler volume driver for indirect costs associated with LRE; (iii) the separation of the cyber-IT and OT re-opener from the one for wayleaves and diversions.
7 We described them in our summary of the DDs, although some details have changed between the DDs and FDs. In particular, the LRE re-opener has been maintained, but with a lower materiality threshold (from 1% to 0.5% of average annual base revenue) and an expanded re-opener window. Concerning the LRE secondary reinforcement volume driver, Ofgem will also provide funding for the procurement of flexibility services, differently from what proposed in the DDs. For the summary of the DDs, see Oxera (2022), ‘RIIO-ED2 Draft Determinations’, 1 July, https://www.oxera.com/insights/agenda/articles/riio-ed2-draft-determinations/ (accessed 5 December 2022).
8 Ofgem (2022), ‘Access and Forward-Looking Charges Significant Code Review:
Final Decision’, 3 May.
9 Further costs will be considered through the LRE re-opener in the second year of RIIO-ED2, when more is known about the impact of the Access SCR.
10 Specified for networks that did not qualify for the infrequent issuer premium, i.e. all DNOs except for EMID, EPN and SSES.
11 Ofgem’s methodology for setting the allowed return on equity is described in our summary of the RIIO-ED2 DDs. See Oxera (2022), ‘RIIO-ED2 Draft Determinations’, 1 July, https://www.oxera.com/insights/agenda/articles/riio-ed2-draft-determinations/ (accessed 5 December 2022).
12 The networks that did not qualify for the infrequent issuer premium are EMID, EPN and SSES.
13 Post normalisations and adjustments, and excluding real price effects (RPEs), OE adjustments, and non-controllable and pass-through costs. £25.2bn represents a reduction of c. £70m from DDs, as a result of changes to cost normalisations and the inclusion of some additional bespoke costs.
14 Net costs, before non-price control allocations and post-modelling adjustments for UMs, excluding RPEs, non-controllable costs and pass-through costs, but including OE.
15 SPMW’s allowance is unchanged compared to the DDs.
16 Ofgem acknowledged that MEAV may not capture the relative impact on costs of overhead lines versus underground cables. By reducing the weight on MEAV and including network length as a driver, Ofgem aims to better account for this cost driver. See Ofgem (2022), ‘Decision – RIIO-ED2 Final Determinations Core Methodology Document’, 30 November, para. 7.110, https://www.ofgem.gov.uk/sites/default/files/2022-11/RIIO-ED2%20Final%20Determinations%20Core%20Methodology.pdf (accessed 5 December 2022).
17 RPEs are similarly applied from 2021/22.
18 The downward revision of the target can be attributed to Ofgem’s judgement, since its consultant, CEPA, has maintained its initial recommendations.
19 For an overview of the CMA’s RIIO-GD2/T2 Final Determinations, see Oxera (2021), ‘RIIO-2 appeals: CMA Final Determination’, 5 November, https://www.oxera.com/insights/agenda/articles/riio-2-appeals-cma-final-determination/ (accessed 5 December 2022).
Contact

Sahar Shamsi, CFA
PartnerContributors
Related
Related
Investing in distribution: ED3 and beyond
The National Infrastructure Commission (NIC) has published its vision for the UK’s electricity distribution network. Below, we review this in the context of Ofgem’s consultation on RIIO-ED31 and its published responses. One of the policy priorities is to ensure that the distribution network is strategically reinforced in preparation… Read More

Leveraged buyouts: a smart strategy or a risky gamble?
The second episode in the Top of the Agenda series on private equity demystifies leveraged buyouts (LBOs); a widely used yet controversial private equity strategy. While LBOs can offer the potential for substantial returns by using debt to finance acquisitions, they also come with significant risks such as excessive debt… Read More
